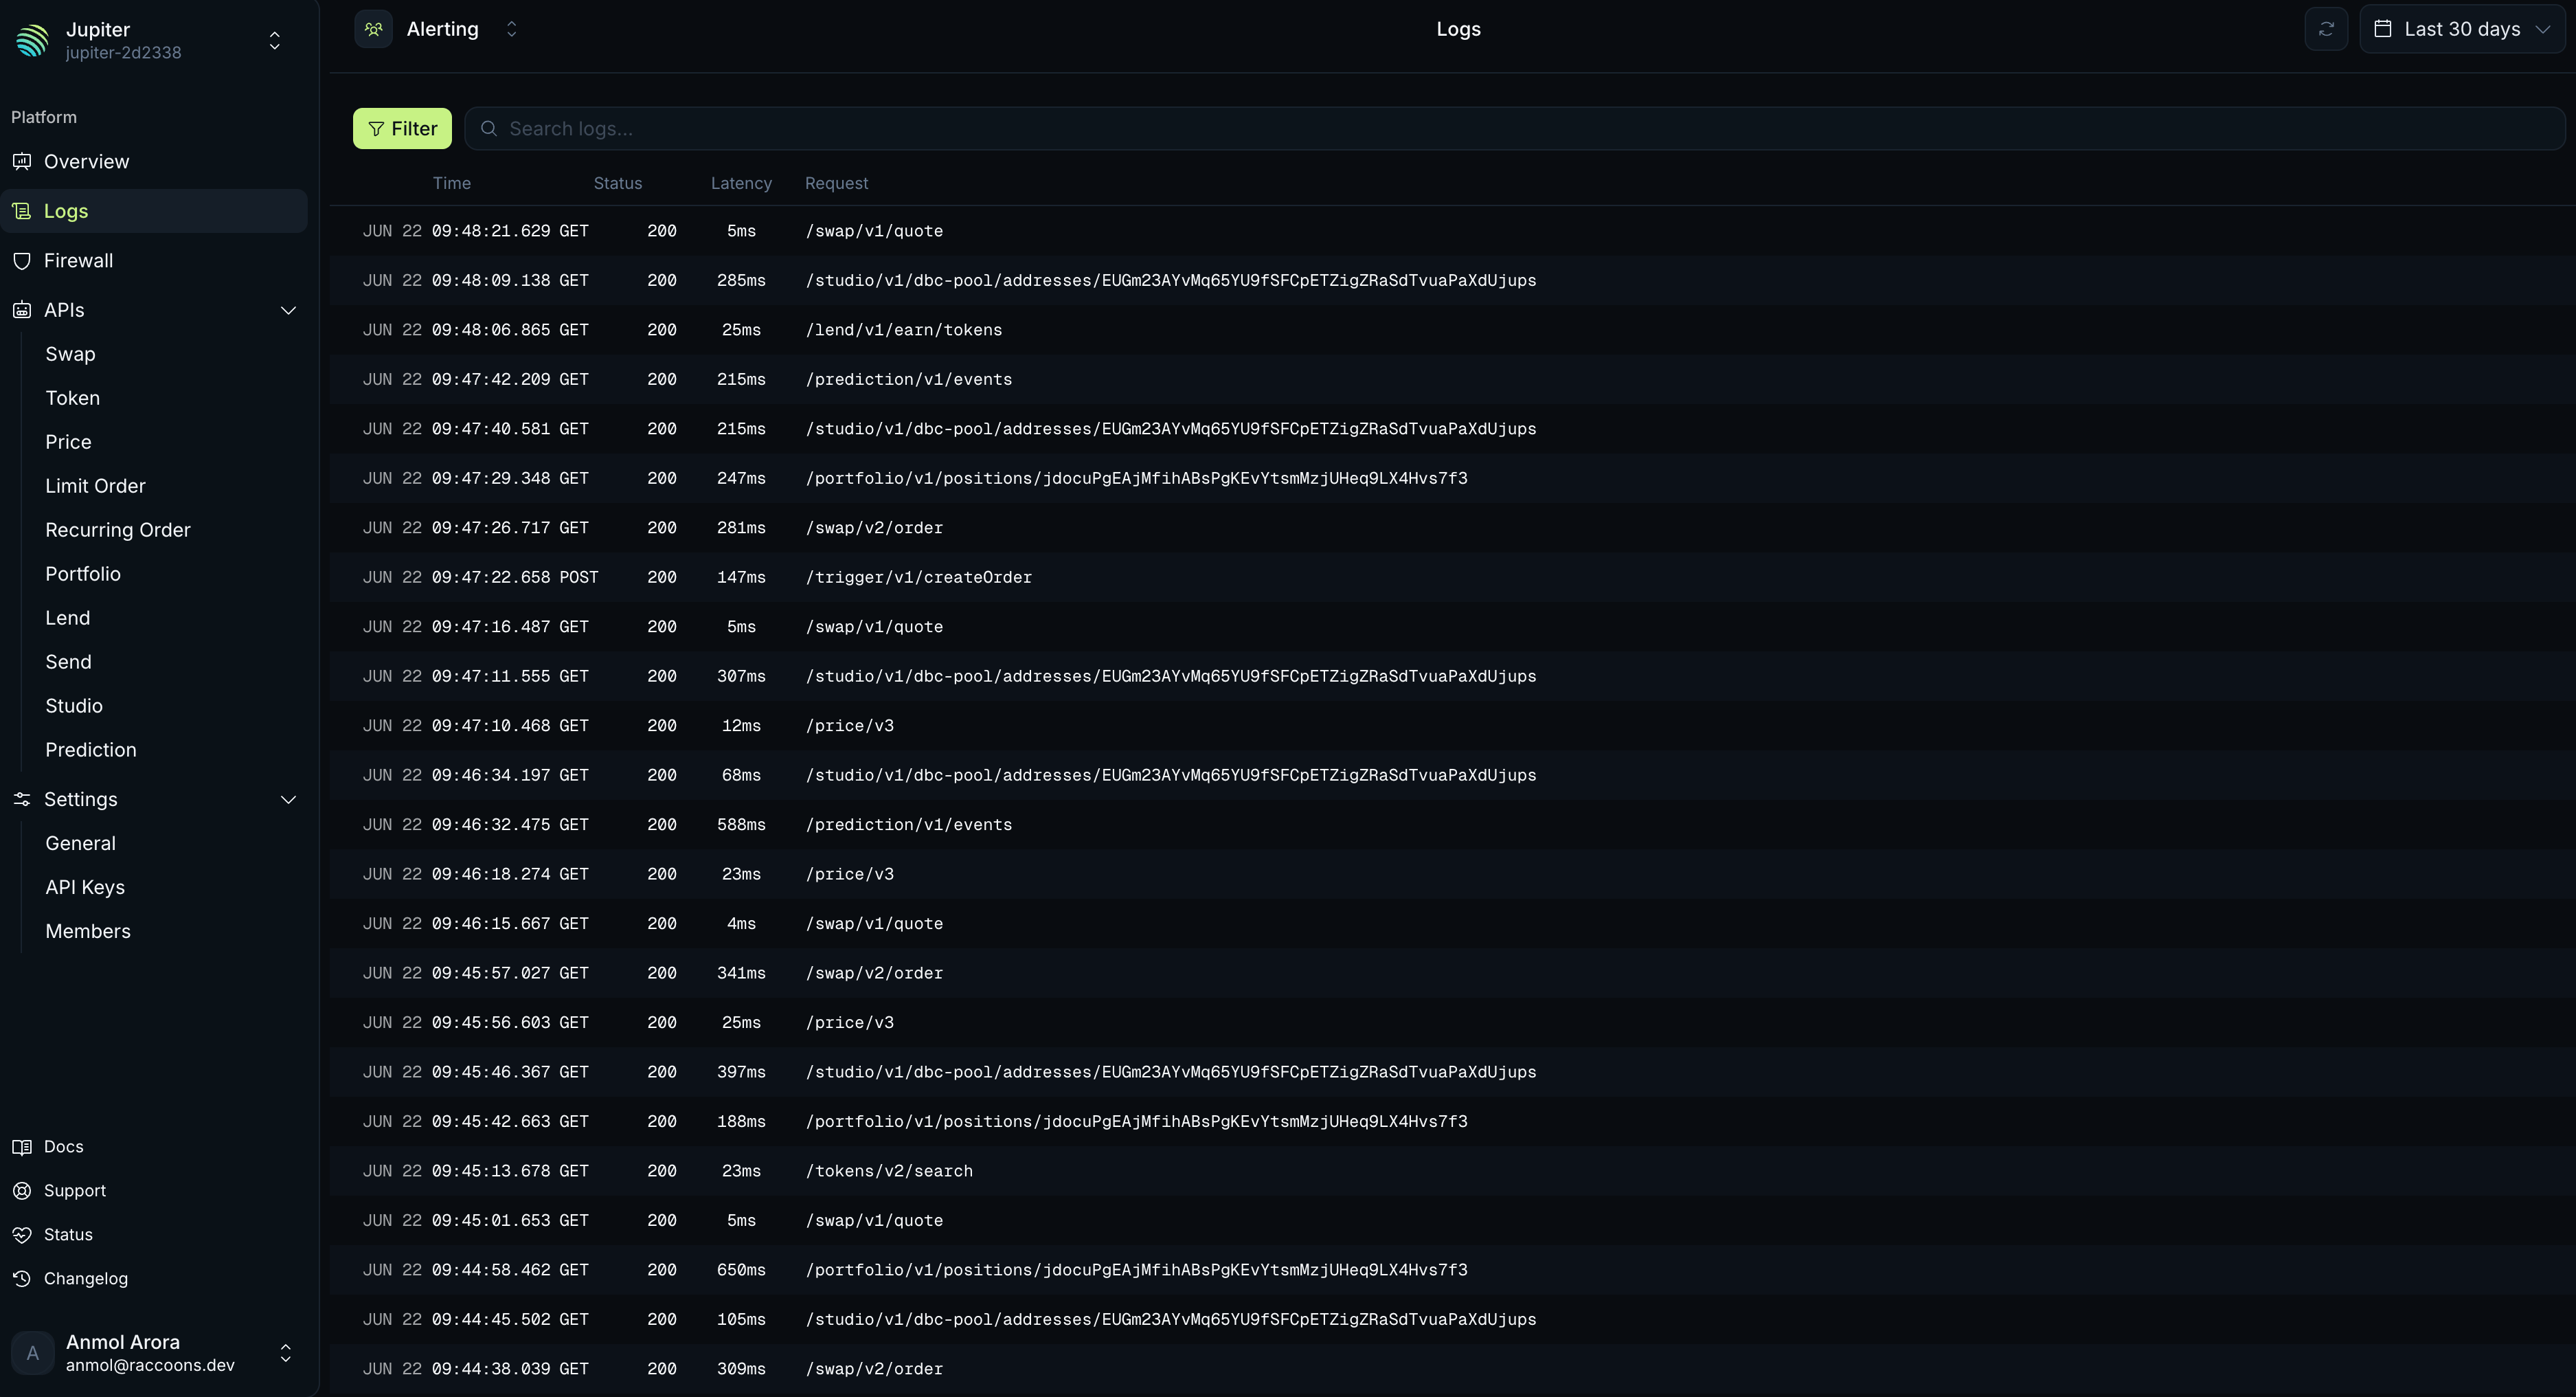
Request logs show the individual requests made with a team’s API keys, newest first. Use them to debug an integration: see the status the gateway returned, how long a request took, how many credits it cost, and which firewall rule, if any, applied.

View and filter

Logs are scoped to a team and listed newest first, with cursor-based pagination. Filter the list by:
  • Status Code
  • Method
  • API Group
  • Path
Request logs list in Portal with status, method, API group, and path filters applied

Request detail

Select a request to open its detail panel. The panel shows the full record for that request, including the firewall decision and the rules that matched.
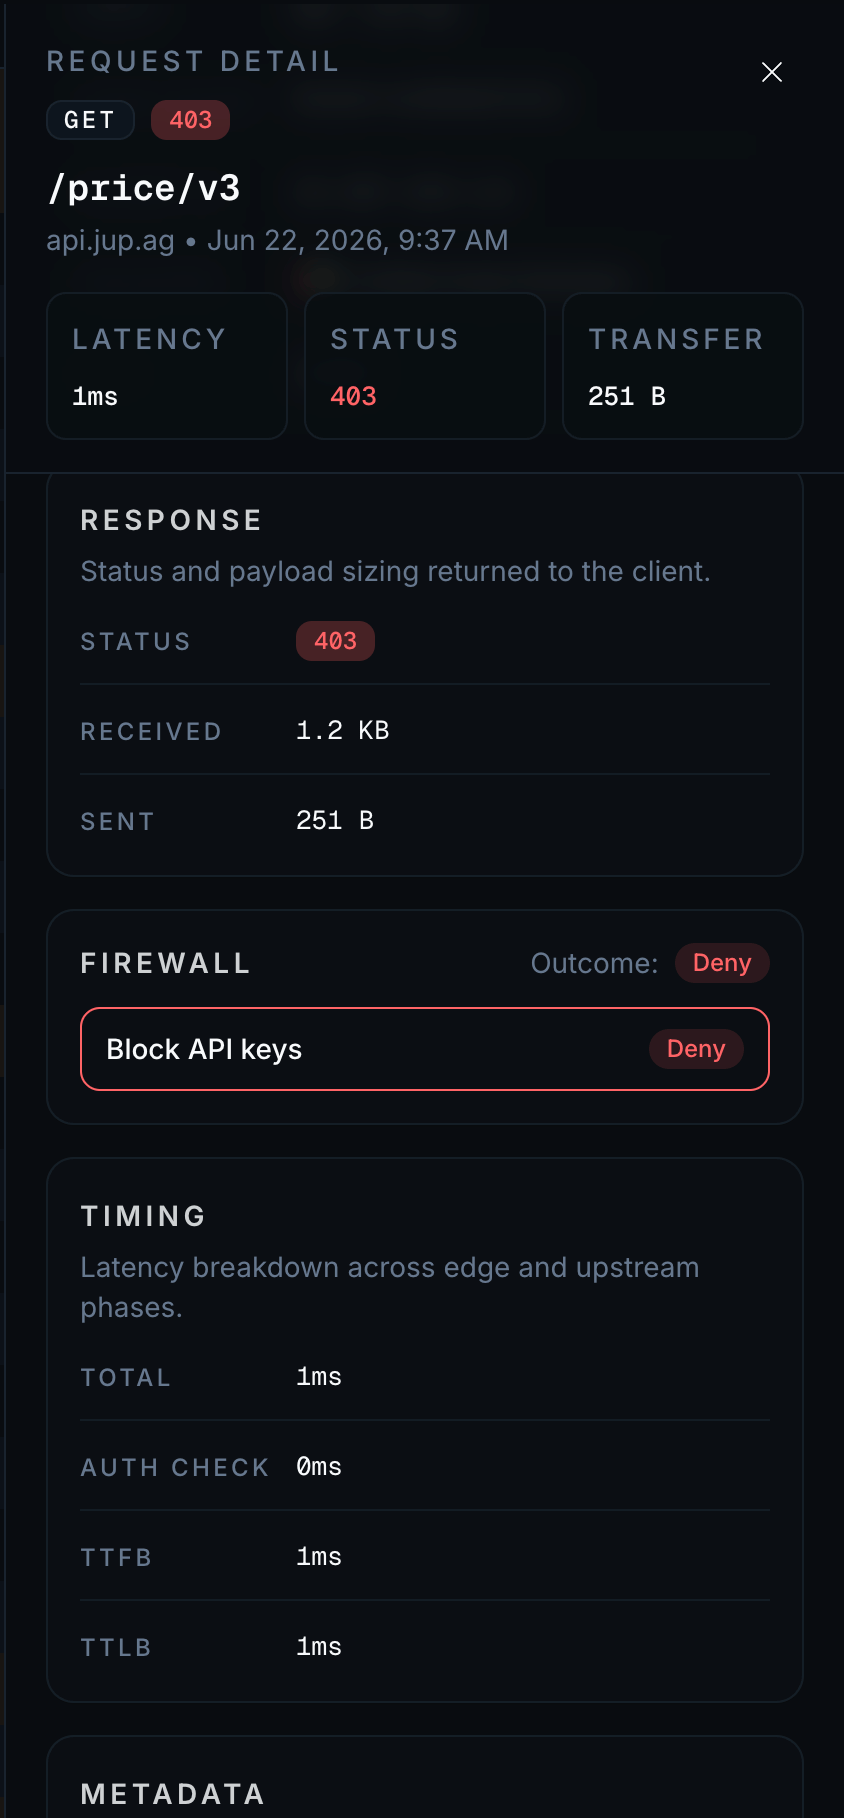
Request log detail panel showing the full record including the firewall decision

Field reference

Each log entry records:
FieldDescription
TimestampWhen the gateway received the request.
Request IDUnique ID for the request.
Client IPThe caller’s IP address.
ASNThe caller’s autonomous system number.
CountryThe country the request came from.
HostThe host the request was sent to.
ReferrerThe referrer header, if sent.
User agentThe user-agent header.
MethodThe HTTP method.
PathThe URI path and query string.
StatusThe HTTP status code returned.
Bytes sent / receivedResponse and request sizes.
Credits consumedCredits the request cost.
LatencyTotal time, broken into auth, time to first byte, and time to last byte.
FirewallThe outcome and the rules that matched.

Retention

Request logs are kept for 6 months.

Analytics

Aggregate traffic, performance, and cost across requests.

Firewall

See the rules behind the firewall decisions in your logs.

Response Codes

What each HTTP status in the logs means.

Plans and Pricing

How credits are counted per endpoint.